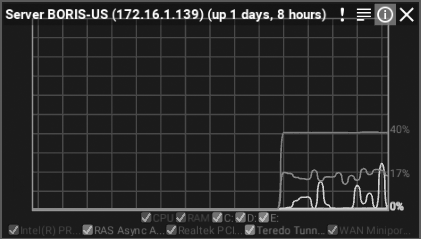
DW Spectrum lets you view server processing usage in real-time, as a standard item that can be moved, resized, duplicated, etc.
To monitor server performance
•Click-and-drag the server from the Resource Tree into a new or existing layout, or
•Open the server context menu and choose Monitor, Monitor in New Tab, or Monitor in New Window to open the chart shown below:

Only traces are displayed unless the cursor is hovered over the graph, which toggles display of the following:
•Server name and elapsed time since the server was last started
•CPU load
•RAM memory usage
•Hard disk partition usage (for example, C: and D:)
•Network interfaces usage
•Percentage of capability being used (on the right side)
Display can be controlled from the legend at the bottom. A trace can be enabled or disabled by checking the box next to its name, and when the mouse cursor is hovered over a name, the corresponding trace will be highlighted while all other traces will be grayed out.
Multiple servers can be monitored simultaneously. To view the health of all available servers in a single layout, use Ctrl + Click to highlight multiple servers and Click-and-drag them from the Resource Tree into a layout. Alternatively, use Ctrl + Click to highlight multiple servers, then open the context menu to select Monitor.
The server monitor item provides a visual indicator if an aspect of server functions reaches a critical level.
More detailed information about the system performance and health is available in "Health Monitoring".